How to use the performance tab?
This tab allows you to keep an eye on the statistics of all your establishments.
The “Performance” tab provides an overview of user interactions with your Google Pages, including visibility, engagement and your business's reputation online.
It allows you to measure the effectiveness of your digital presence through detailed statistics. This data, presented in graphical form and filterable by period or company, is crucial for evaluating and optimizing your communication and customer service strategy.
Click on "Performance".
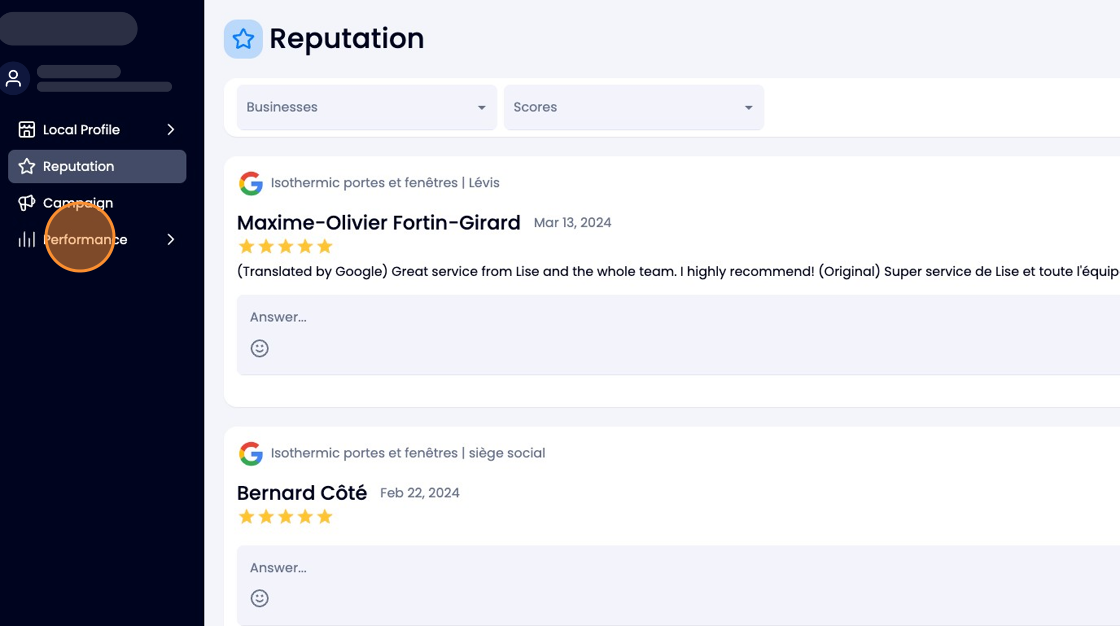
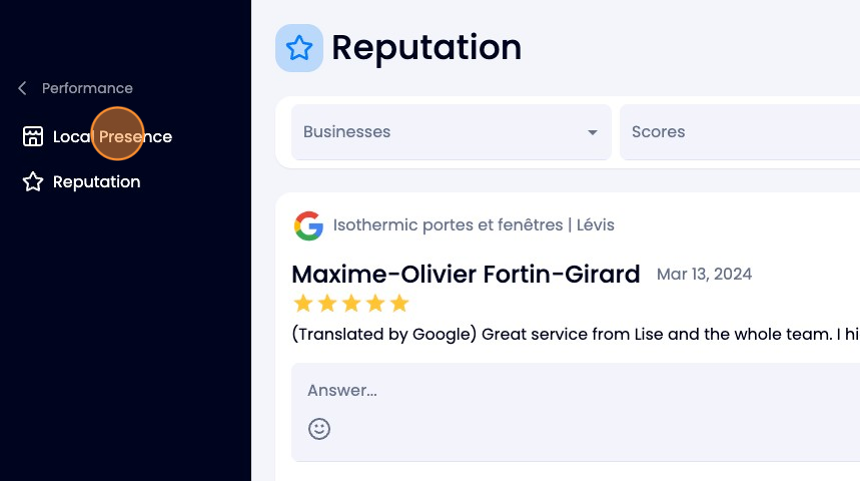
Subsequently, two options are available to you: Local presence and Reputation.
Local Presence
Click on "Local Presence".
Upon arriving at this tab, you will see this first page appear:
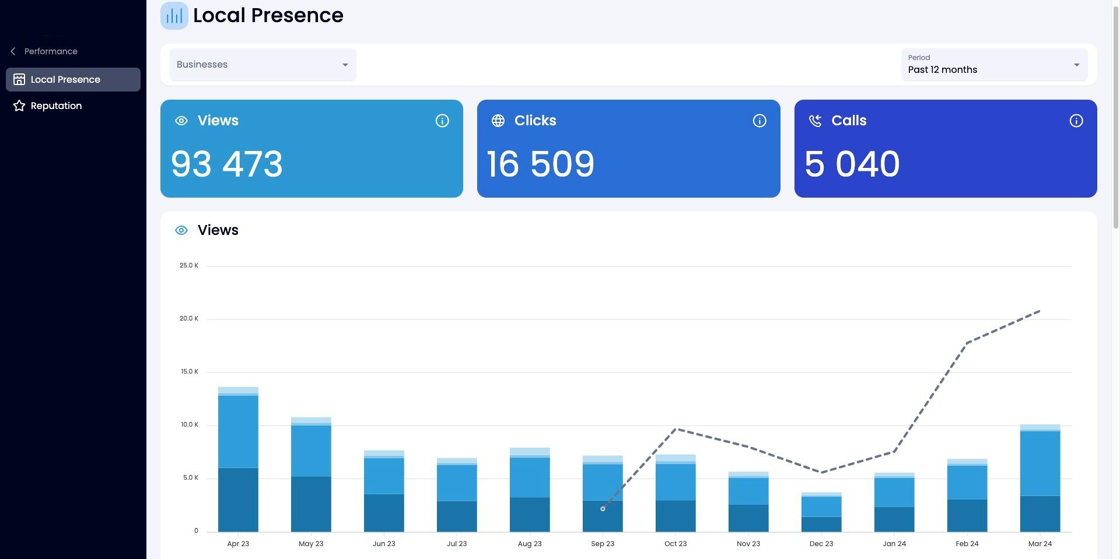
On this tab, you will be able to see 3 graphs:
Views
Allows you to visualize the number of views of your Google page depending on whether they were viewed via a PC or phone, as well as Google Maps or Google search.
Clicks
Allows you to visualize the number of clicks your Google page gets, based on where the customers clicked (message, calls, website visits and itinerary).
Calls
Allows you to visualize the number of calls you have received.
At the top of the tab, you will have the total of each categories.
Reputation
Click on "Reputation".
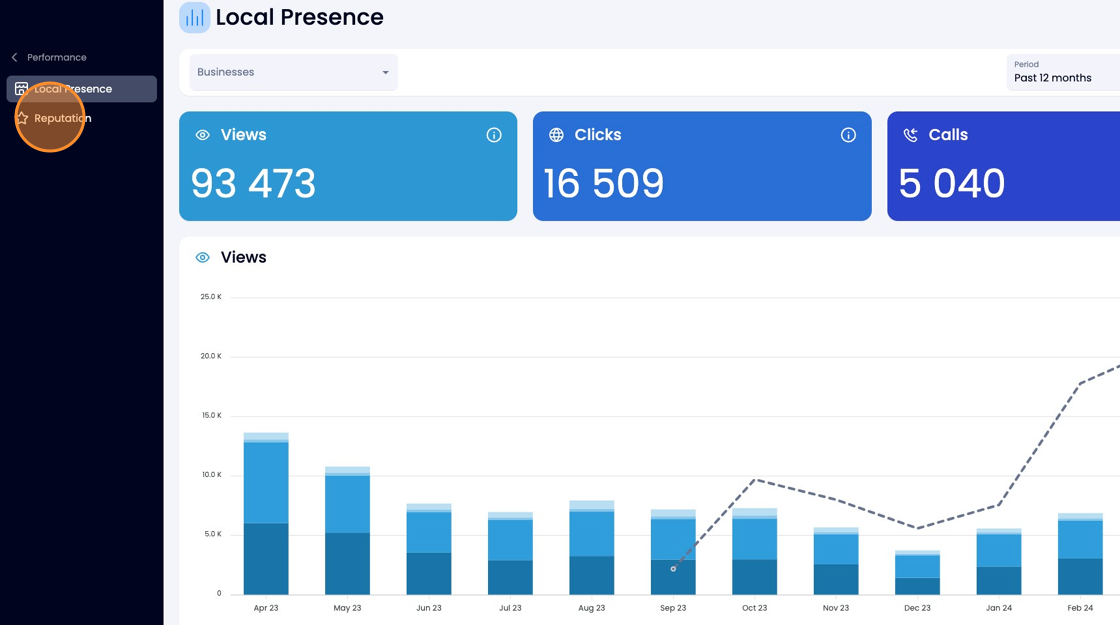
Upon arriving at this tab, you will see this first page appear:
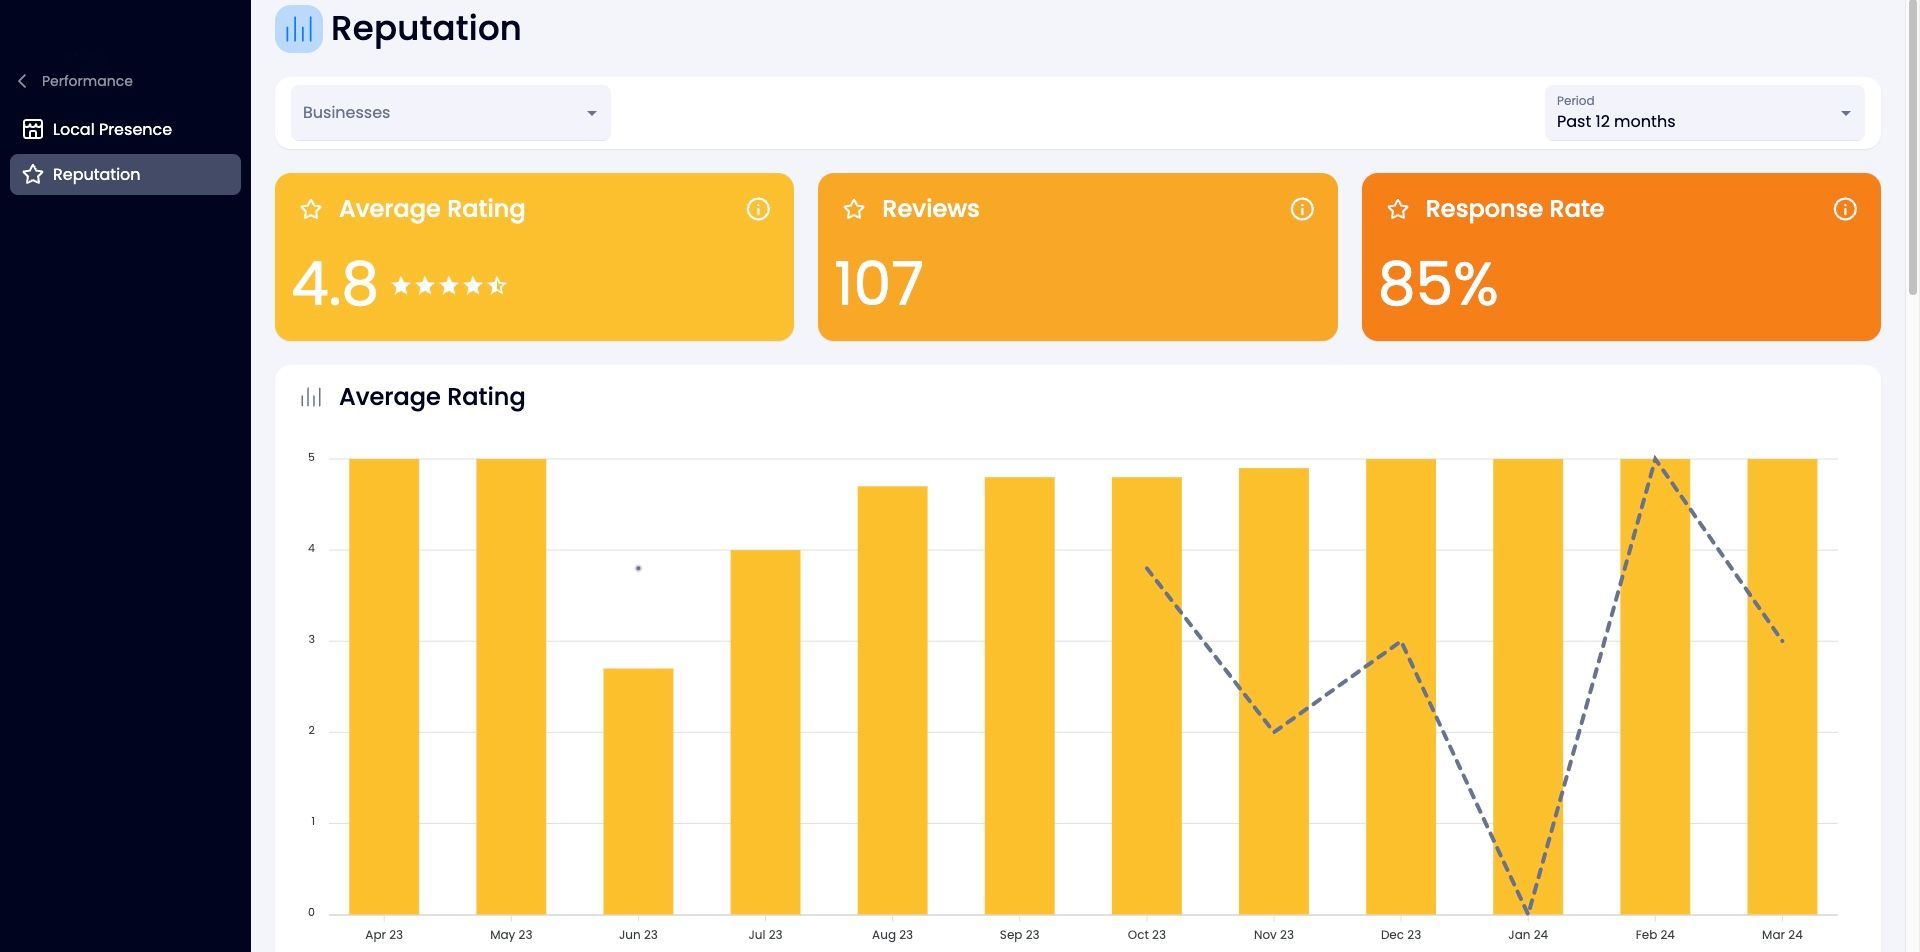
On this page, you will be able to see 4 charts: Average rating, comments, response rate and review requests.
Average Rating
Allows you to visualize the average rating given by customers.
Comments
Allows you to see the number of reviews left by customers.
Response Rate
Allows you to see the response rate you have achieved for the various customer reviews.
Review Requests
Allows you to see the number of review requests you have made, whether by SMS or email.
How to Apply Filters Correctly?
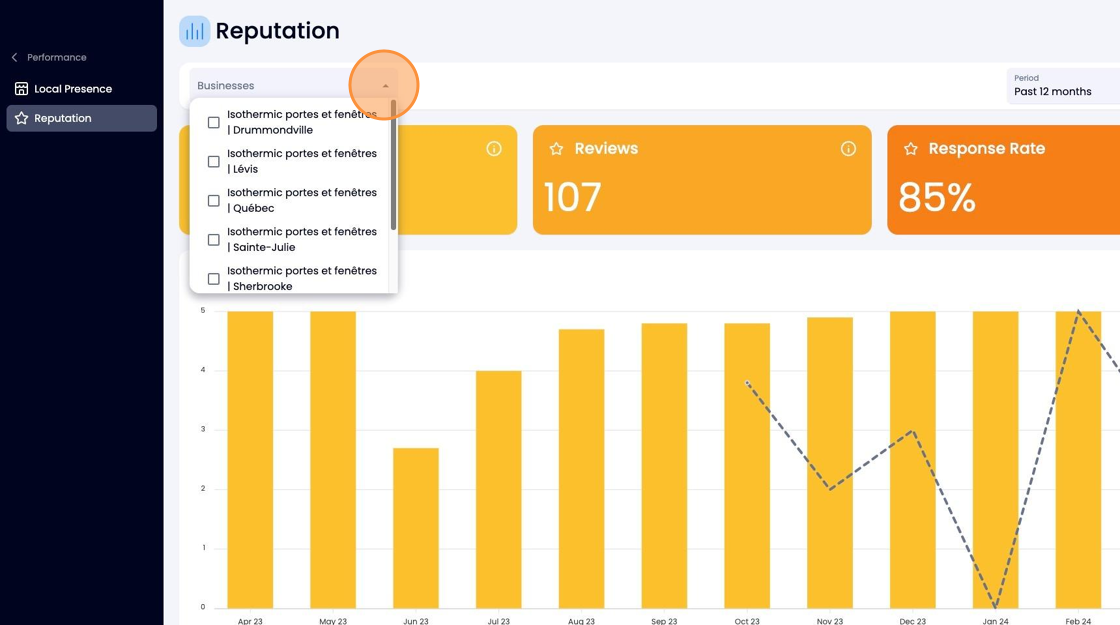
Of course, it is possible to sort them based on different establishments and by period (you can combine these 2 filters). The method of filtering is exactly the same as the "Local Presence" and "Reputation" tab.
For the filter, click on "Establishment".
Then select the establishment(s) you wish to view.
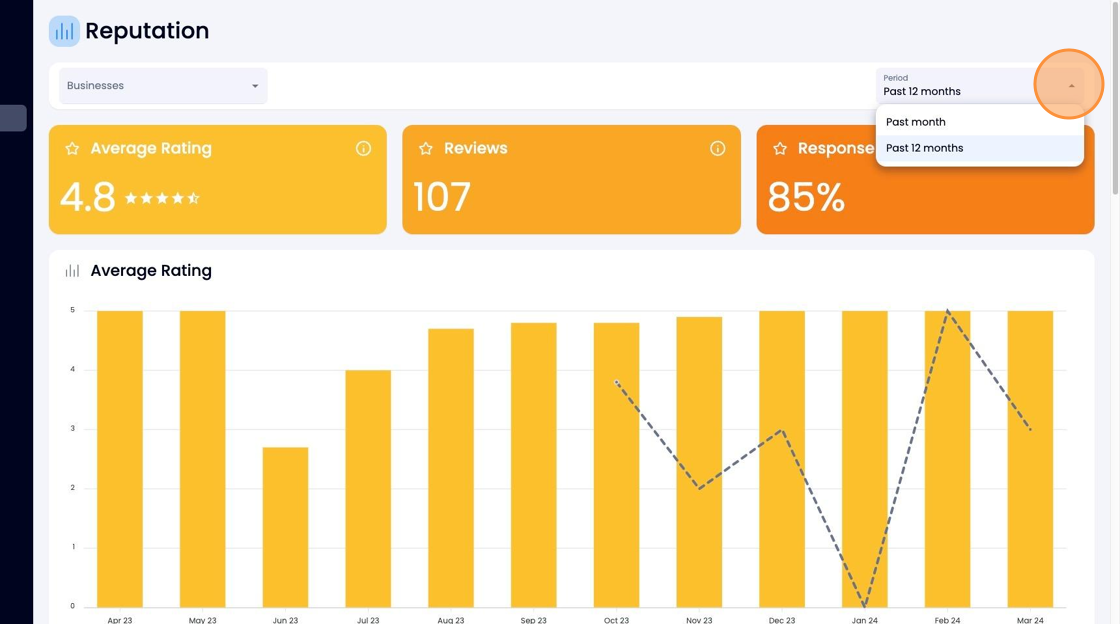
To filter by period, click on "period".
Subsequently, you will be able to select the period you want to see.
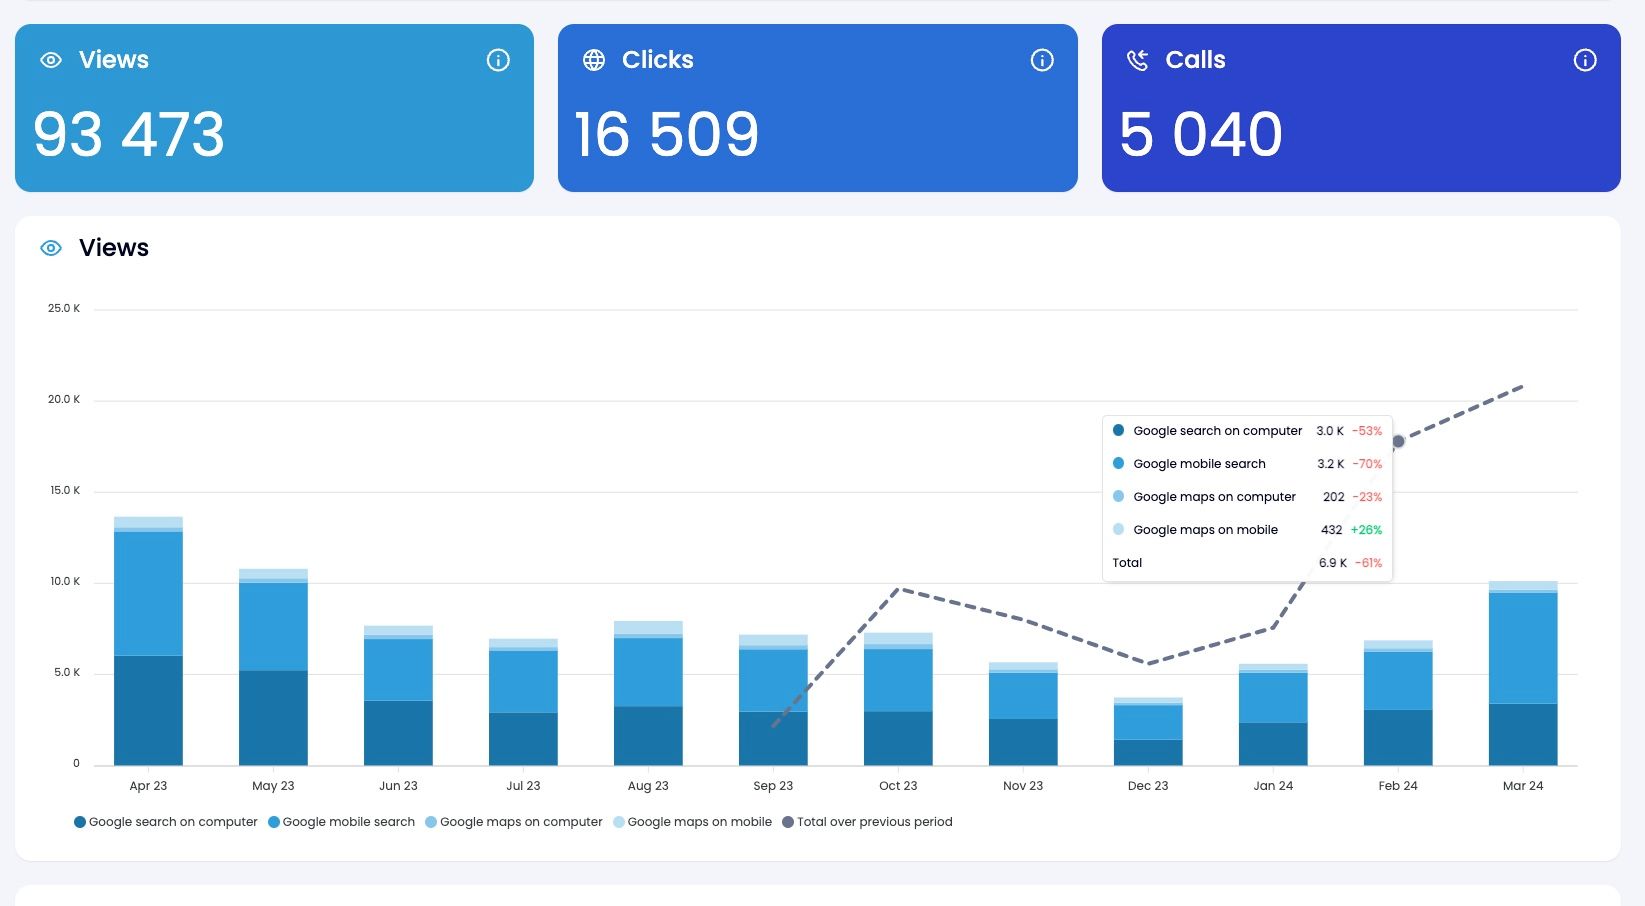
Whether on the “Local Presence” or “Reputation” tab, you will be able to see the total for each category appear at the top of the page (depending on the filters applied).

Below the graphics, you have the description of each color used.
You will also be able to observe a black curve, which represents performance at the same period but last year.
The percentage corresponds to the growth rate of the selected category.
There you go! You're now able to manage your establishment's statistics.
